# RFM
RFM allows grouping customers by segments with different value for your company and create different communication strategies for every group.
# Segments description
Traditionally, customers can be grouped to these segments:
Champions – Bought recently, buy often and spend the most! Reward them. Can be early adopters for new products. Will promote your brand.
Loyal Customers – Spend good money with us often. Responsive to promotions. Upsell higher value products. Ask for reviews. Engage them.
Potential Loyalist – Recent customers, but spent a good amount and bought more than once. Offer membership / loyalty program, recommend other products.
Recent Customers – Bought most recently, but not often. Provide on-boarding support, give them early success, start building relationship.
Promising – Recent shoppers, but haven’t spent much. Create brand awareness, offer free trials
Customers Needing Attention – Above average recency, frequency and monetary values. May not have bought very recently though. Make limited time offers, Recommend based on past purchases. Reactivate them.
About To Sleep – Below average recency, frequency and monetary values. Will lose them if not reactivated. Share valuable resources, recommend popular products / renewals at discount, reconnect with them.
At Risk – Spent big money and purchased often. But long time ago. Need to bring them back! Send personalized emails to reconnect, offer renewals, provide helpful resources.
Can’t Lose Them – Made biggest purchases, and often. But haven’t returned for a long time. Win them back via renewals or newer products, don’t lose them to competition, talk to them.
Hibernating – Last purchase was long back, low spenders and low number of orders. Offer other relevant products and special discounts. Recreate brand value.
Lost – Lowest recency, frequency and monetary scores. Revive interest with reach out campaign, ignore otherwise.
# Calculation
RFM segments are calculated by standard 5⨉5⨉5 matrix.
Platform takes all purchases for N months. By default, N=12. Ask your manager to change this number, if you need it.
Algorithm removes 2% of anomalies (by monetary, frequency and recency). And distribute all customers to their cell in the matrix.
Example
Initial data:
- Time frame – 12 months
- The first purchase was 12 months ago
- The last purchase was today
- Min purchases per customer – 1
- Max purchases per customer – 10
- Min revenue per customer – $100
- Max revenue per customer – $1000
Matric steps as results:
- R – 12/5 = 2.4 month
- F - 2 purchases
- M - $200
To simplify, 3D matrix is flattened to 2D matrix: R ⨉ 𝑓(FM).
As a result, this table is used to group customers by segments:
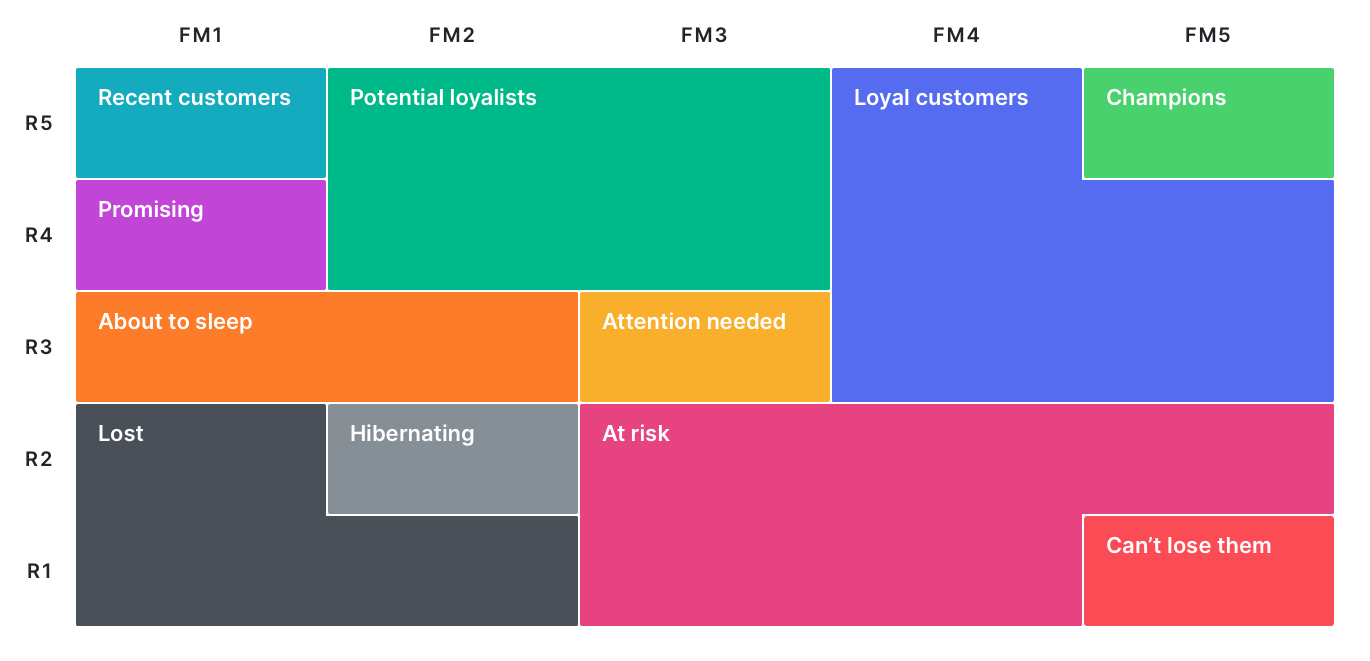
# Moving between segments
RFM segments are recalculated daily. In the process, some customers can transfer from one segment to another. You can create trigger messages for these events.